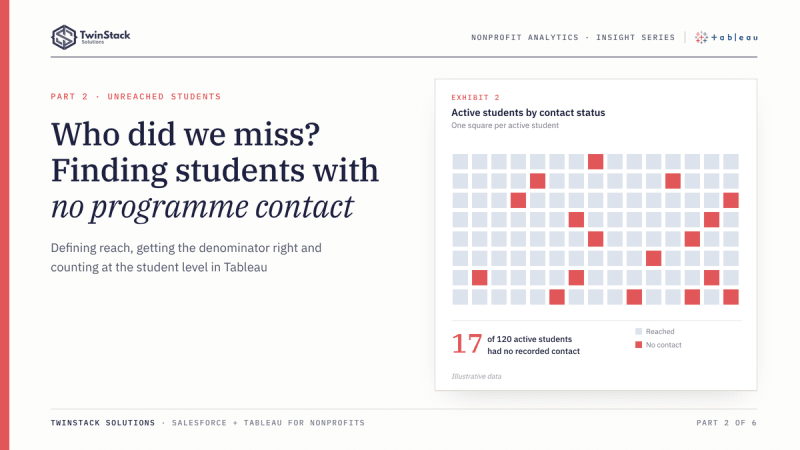
Short answer: an unreached students dashboard works when you define "reached" for each programme, limit the count to active enrolments, and classify each student once before counting. Then the gap list builds itself.
A programme can log a thousand activities and still miss a student entirely. Totals hide that. A count of visits, calls and meetings says how busy the team was. It says nothing about who was left out.
That gap is the reason we built a dedicated Unreached Students dashboard for a school-based family engagement programme, as part of a wider Salesforce and Tableau project. The idea is simple: turn "who have we not reached?" from a question someone answers with a one-off export into a list a coordinator can open on Monday morning.
Why finding unreached students is harder than it sounds
Define what "reached" means
To say a student is unreached, you first have to say what reached means. In this programme the answer differs by type of work:
- Relationship Building: reached means at least one home visit or community visit.
- Academic Partnering: reached means activity in at least two distinct windows of the school year. One window is a partial reach.
- Ongoing Communications: reached means at least one communication touchpoint, and the programme also looks at students with two, and with three or more.
Get the denominator right
Only students with an active enrolment should appear. A student who has left the school is not a gap in outreach, and including them would make every reach rate look worse than it is.
Count at the right grain
Activities sit in a one-to-many relationship with enrolments. A student with twelve activities appears twelve times in any table that joins the two. Count rows and that student is counted twelve times. Ask "how many students had zero activities?" and the answer cannot even be found by counting rows, because students with no activity have no activity rows at all.
How the Tableau dashboard answers it
The workbook handles the grain in two steps. First, a student-level calculation counts each student's activities by programme, using a FIXED level-of-detail expression on the student's enrolment record. Second, a status field turns that count into a label: for Relationship Building, "Reached - Home Visit", "Reached - Community Visit" or "Unreached"; for Academic Partnering, "Reached", "1 Touchpoint" or "Unreached"; for communications, "3+ Touchpoints" down to "Unreached". Once every student carries a label, counting students by label is straightforward, and a student appears once.
The Unreached Students dashboard then does three things:
- It shows one headline count per programme: unreached relationship-building students, students not yet reached in Academic Partnering, and unreached communications students. All three count active enrolments only.
- It lists the students behind each count, one list per programme, so the number is something a person can act on.
- It has a "no activity" measure for students who are unreached in all three programmes at once. These are the students nobody has touched.
The lists respond to the same School and School Year filters as the rest of the workbook, and the communications list also responds to a meeting-type parameter. A coordinator can look at one school, one year, one kind of meeting.
An illustrative example
This example is hypothetical and is not project data. Suppose a school shows a healthy overall communications rate, with most students contacted at least once. The headline looks fine. Opening the Unreached list for that school shows that the uncontacted students are concentrated in a single grade. The programme lead sees a pattern a total could never show, and can assign the follow-up to the educators who work with that grade.
Where Salesforce reports fit
Salesforce can answer part of this natively. A cross filter on a report can list students that have, or do not have, related activity records, and a report filtered to active enrolments gives the right population. For a single programme, that may be all a team needs.
The harder part is combining three definitions of "reached", with different thresholds, into consistent status labels, and showing them alongside an all-programmes view in one place. That is where we found Tableau's calculation language and data model easier to work with. We would not describe this as something Salesforce cannot do. It is a question of how much custom reporting you want to build and maintain.
What management can do with it
The dashboard does not fix outreach. It changes the conversation. Instead of asking whether the team is doing enough, a manager can ask which students have had no contact, which school they attend and which educator is closest to them. Those are decisions someone can make in a staff meeting.
Two cautions apply. A student labelled unreached may have been contacted in a way nobody recorded, so the dashboard is only as good as the activity data entered in Salesforce. And a list is a starting point for follow-up, not a verdict on anyone's work.
The takeaway
Finding engagement gaps is a modelling problem before it is a visualisation problem. Define reached, restrict to active students, classify each student once, and then the gap list builds itself. Salesforce holds the activity record. Tableau turns it into a list of people to call.
Frequently asked questions
How do you find students with no activity in Salesforce?
A report with a cross filter can list students without related activity records. For several programmes with different definitions of reached, a Tableau status field per student keeps the lists consistent.
Why not just count activity rows?
Rows repeat a student once per activity, and students with no activity have no rows at all. Classify each student first, then count students.
Should students who have left be included?
No. Limit the population to active enrolments, or every reach rate will look worse than it is.
Want dashboards like these for your programme? Book a free 45-minute call or see our Tableau dashboard services.