Short answer: measure communication by depth (touchpoints per student), direction (two-way or one-way) and timing (by month and channel). Show distributions rather than averages, and make every view obey the same filters.
Every nonprofit that contacts families keeps a record of it. Far fewer can say whether the contact is working. Effectiveness is a difficult word, and a dashboard cannot prove it. What it can do is describe the pattern of communication clearly enough that a team can see where to look next.
That was the aim of the Ongoing Communications dashboard in our Salesforce and Tableau project. This article covers what it measures, what it deliberately does not claim, and why the measures needed some care to build.
Three things worth measuring
From the activity records in Salesforce, three questions can be answered with reasonable honesty:
- Depth. How many communication touchpoints has each student had? One contact is a very different relationship from three or more.
- Direction. Was the communication two-way? A message sent is not the same as a conversation held. Salesforce records whether a communication was two-way, and that field turns a count of contacts into something closer to engagement.
- Channel and timing. Which channels carry the volume, and how does that change from month to month?
None of these measures an outcome. They describe the shape of outreach, and the shape is where a team can act.
What we built
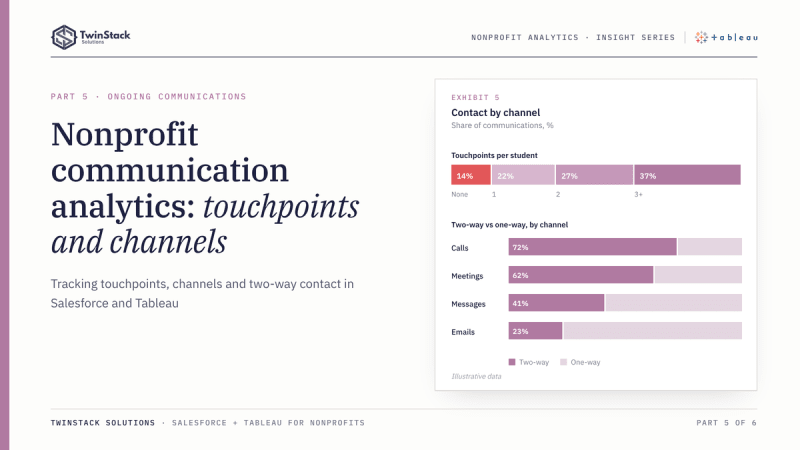
The dashboard starts with the distribution of touchpoints per student, in four groups: none, one, two, and three or more. This is more useful than an average. An average of two touchpoints per student can describe a programme where everyone has two, or one where half have four and half have none. The distribution shows which.
A monthly view shows communication volume by channel over time. A companion view compares two-way and one-way communication across channels, so it is clear which channels produce conversations and which mostly send messages. As on the other programme dashboards, reach is broken down by gender, race and grade level against the overall average, and a student list sits underneath for follow-up.
The communications measures are driven by three parameters: meeting type, a time range, and whether the communication was two-way. The time range splits the year into autumn and spring semesters by activity date, with autumn beginning in August. All three default to All, so the default view is the full picture and narrowing is a deliberate choice. In the published workbook, the meeting-type control is shown on the Unreached Students and Activity Detail dashboards.
Why this needed more than a chart
The parameters create a modelling problem. If a user selects "two-way only", the student-level touchpoint count has to respond too. Otherwise, a student could show three touchpoints in a chart while the list beside it, filtered differently, shows one. In the workbook, the parameter conditions are built into the calculation that counts each student's touchpoints and into a single "in scope" field. The chart, the status groups and the student list all use the same rule, so they agree with each other.
The second detail is counting. Each student's touchpoints are a distinct count of activity IDs at the student level, so a student is never counted once per activity row. The third is the population. As elsewhere, reach rates use active enrolments only.
An illustrative example
This example is hypothetical and is not project data. A team sends frequent messages in one channel, and total volume looks high. The two-way view shows that almost none of those messages produced a reply, while a smaller channel generates most of the real conversations. The team does not conclude that the large channel has failed. It asks whether it is meant to be a broadcast channel, and whether the families who only receive broadcasts are the ones being missed.
What Salesforce reporting covers
Salesforce reports can group communications by month and type, filter on the two-way flag and chart the result. A report filter or a dashboard filter lets a user narrow the view. For a single question of that kind, native reporting is quick and keeps everything in one place.
The added requirement in our project was consistency across several views, including a student-level touchpoint classification that follows the same filters as the charts. Parameters and calculated fields made that straightforward in Tableau. In Salesforce the same behaviour would generally need several reports built and maintained together.
What management can do with it
- Identify students with no contact and route them to the unreached list.
- Distinguish broadcast channels from conversational ones.
- See whether communication drops in certain months or semesters.
- Check whether depth of contact is even across grades and groups.
A caution belongs here. Two-way communication is a record of an exchange, not of understanding or outcome. A reply is a signal worth noticing, not proof of effectiveness.
The takeaway
To understand communication, measure depth, direction and timing, show distributions rather than averages, and make every view obey the same filters. Then the dashboard describes outreach honestly, and the team decides what it means.
Frequently asked questions
Why show a distribution instead of an average?
An average of two touchpoints can hide half the students having none. Grouping students into none, one, two, and three or more shows who is missing out.
How do you track two-way communication in Salesforce?
Record whether each communication was two-way on the activity, then report on that field or use it as a parameter in Tableau.
Why must the student list follow the same filters as the charts?
Otherwise a student can show three touchpoints in a chart and one in the list. Building parameter conditions into one "in scope" field keeps every view consistent.
Want dashboards like these for your programme? Book a free 45-minute call or see our Tableau dashboard services.