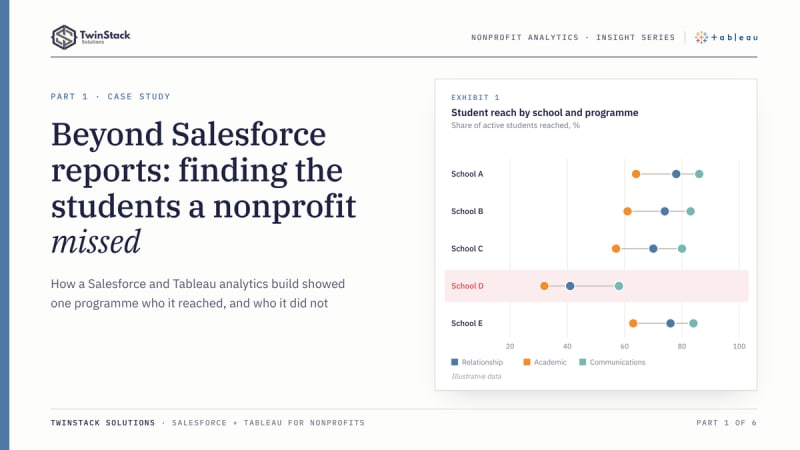
Short answer: Salesforce reports are often the right tool for operational counts, and they sit where staff already work. Tableau earns its place when the questions cut across many related objects, need counting at the student level rather than the activity level, and have to stay consistent across several dashboards. This case study shows where each tool fits in a real nonprofit project.
Funders, boards and programme leaders no longer ask only how much activity a nonprofit delivered. They ask who it reached, and who it missed. Salesforce is where that activity gets recorded. The harder question is what the record says once thousands of visits, calls and meetings are sitting in it.
We built a Salesforce and Tableau analytics solution for a school-based family engagement programme. It is a useful project for looking at where each tool earns its place.
The business challenge
The programme does three kinds of work with families. Relationship Building covers home and community visits. Academic Partnering is a set of structured touchpoints across numbered windows in the school year. Ongoing Communications covers calls, meetings and messages by channel. Educators on each school's roster take part in all of it. Every interaction is recorded in Salesforce as an activity tied to a student's enrolment.
The questions that matter cut across those records:
- Which active students have had no contact of any kind?
- Is one school falling behind the others?
- Are students in certain grades, or of a certain gender or race, reached less often than average?
- Which eligible educators have logged nothing?
Each answer means connecting activities to enrolments, enrolments to students and schools, and activities to educators, then counting at the right level.
Why Salesforce reporting alone was not enough for these requirements
Salesforce native reporting is capable. Custom report types span related objects, joined reports place several blocks side by side, cross filters find records with or without related records, and row-level and summary formulas cover a lot of calculation. For a count of activities by school this month, a Salesforce report and dashboard is often the right answer.
Our requirements leaned on three other things:
- Model. The data spans nine objects, and some play more than one role. Account is a student's school, an educator's school and a parent organisation. School Year links to both enrolments and rosters.
- Grain. The headline measures are about students, not activities. A student counts as reached in Academic Partnering only after activity in at least two distinct windows, and Ongoing Communications is tiered at one, two, or three or more touchpoints. You classify each student first, then count students by class.
- Presentation. Heat tables, comparisons by gender, race and grade, and one School and School Year filter carried across the dashboards.
All three can be approximated in native reports with enough custom report types and formulas. In our build, Tableau's data model and calculation language made them easier to construct, change and keep consistent. That is a judgement about fit, not a hard limit of Salesforce.
Our Salesforce and Tableau solution
Salesforce stays the system of record. Tableau connects to it and models the objects through relationships rather than physical joins. In a relationship, each table keeps its own level of detail and Tableau builds the joins at query time from the fields in the view (Tableau documentation). That matters when one enrolment has many activities, because a pre-merged table would repeat the enrolment on every activity row and inflate student counts.
We added our own safeguards. Counts use distinct record IDs, so a student with twelve visits is still one student. Student-level status fields use FIXED level-of-detail expressions, which compute at the dimensions you name and ignore the rest of the view. The business rules sit in named calculated fields: active enrolment only, home versus community visit, windows reached and touchpoint tiers. A meeting-type parameter filters communications. The workbook was published to Tableau Cloud.
Seven dashboards, seven business perspectives
Every dashboard carries the same School Year and School Name filters and a left-hand menu that links all seven. Filter actions tie each chart to the list beside it: selecting a mark, such as a slice of the status donut or a dot on the race, gender or grade chart, narrows the student list to the students behind that mark.
Overview
Asks where the programme stands and where to look first. It shows reach across the three programme areas, a trend over time and a school scorecard, so a leader can spot the school or programme that is lagging before opening anything else.
Relationship Building
Asks whether visits are reaching students, and what kind. A donut splits active students into home-visit reached, community-visit reached and unreached, a monthly view shows the rhythm of visits, and reach by gender, race and grade is set against the school average, with marks coloured above or below it. Clicking the unreached slice, or a race, gender or grade mark, filters Student Details to those students, so a coordinator goes from a pattern to names in one step.
Academic Partnering
Asks whether contact is sustained across the school year. It counts the windows in which each student was reached, which shows where reach drops between windows, and the same group comparisons and click-to-filter list apply.
Ongoing Communications
Asks how deep contact goes and through which channels. It shows the share of students with none, one, two, or three or more touchpoints, communication volume by month and channel, and reach at three or more touchpoints by gender, race and grade.
Unreached Students
Asks who has had no contact. It turns the gaps into named lists by programme, plus the students with no activity in any programme, which is the follow-up list for the week.
Educator Activity
Asks which educators are taking part. It compares eligible educators with active ones and bands them by activity volume, so a roster with silent members stands out.
Activity Detail
Asks what records sit behind a number. It lists activities with student, grade, gender, race, activity date, group and subtype, and can be narrowed by school year, school, meeting type and activity group, so any figure on another dashboard can be checked against its source records.
The three programme dashboards compare reach by gender, race and grade against the school average. Because those marks also act as filters, the equity question and the follow-up list are one click apart.
Business impact
The value of the solution lies in the specific reporting problems it removes. We have not measured outcomes, and this post does not claim any.
- One definition of "reached". The rules for each programme (a home or community visit, two or more windows, one to three or more touchpoints) are written into calculated fields, so every dashboard applies them the same way and a change is made once.
- Accurate student counts. A relationship-based data model, distinct counts and student-level calculations keep a student with many activities from being counted many times, so reach rates reflect students and not activity rows.
- Gaps that can be acted on. Unreached students are identified by name, by programme and by school, which turns a percentage into a follow-up list for coordinators.
- Equity visibility. Reach by gender, race and grade is compared with the school average on the same dashboard, and a click on any mark filters the student list behind it.
- A traceable audit trail. Activity Detail exposes the underlying records, so any figure shown to leadership can be checked against its source in Salesforce.
- A single analytical view for leadership. Seven dashboards share one model and one set of filters, so leaders do not have to reconcile separate reports.
Conclusion
Salesforce records what the organisation does. Tableau helps it understand what that record means, by connecting perspectives that live in different objects, classifying students at the right grain, and showing patterns that a list of activities hides. Choosing between them is not about which one draws nicer charts. It is about the questions you need answered, the reliability of the data model, and the decisions that follow.
Frequently asked questions
Should a nonprofit use Salesforce reports or Tableau?
Use Salesforce reports and dashboards for operational counts, such as activities by school this month. Consider Tableau when questions span many related objects, need student-level counting and must stay consistent across several dashboards.
Does Tableau replace Salesforce?
No. In this project Salesforce stays the system of record where staff log activity and data is governed. Tableau connects to Salesforce and sits on top for cross-object analysis.
How do you stop Tableau double-counting students?
Use relationships rather than flattened joins, count distinct record IDs, and calculate student-level status with FIXED level-of-detail expressions before counting students.
Can these dashboards be built in Salesforce alone?
Much of it can be approximated with custom report types, joined reports, cross filters and formulas. The choice is about how much custom reporting you want to build and maintain, not about what is possible.
Working out whether your nonprofit needs Tableau or better Salesforce reports? See our Salesforce for nonprofits services or read on through the series.