Short answer: track academic partnering by coverage and consistency, not volume. Count the distinct windows each student was reached in, keep the denominator fixed across windows, and write the rule into one calculated field.
Academic partnering is work that happens over time. A single contact with a family in September says little about the year. What matters is whether the contact keeps happening, and whether it reaches the same students at each stage of the school year.
The programme we worked with tracks this in numbered windows. Each Academic Partnering activity in Salesforce is tied to a window, and the Academic Partnering dashboard in our Salesforce and Tableau project was built around that structure. This article explains what that design makes visible, and why it needed more than a count of activities.
The measurement problem
Suppose you only counted Academic Partnering activities. A school with 400 activities would look busier than a school with 250. But the 400 might all fall in the first window and reach the same hundred students, while the 250 are spread across every window and reach most of the school. The count rewards volume. It cannot tell you about coverage or consistency.
The programme's own definition reflects this. A student counts as reached in Academic Partnering when they have activity in at least two distinct windows. One window is a partial reach. No windows is unreached. The rule is about spread, not volume, and that changes what the dashboard has to calculate.
What the academic partnering dashboard shows
- Status mix. Active students are split into three groups: reached (two or more windows), one touchpoint (one window), and unreached. A single bar shows how the population divides.
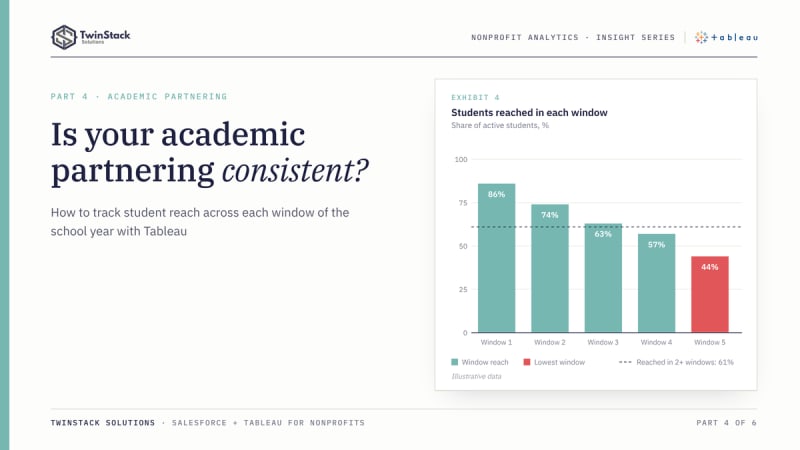
- Reach by window. A line shows the share of active students reached in each window. The shape matters more than any one point. A steady line means consistent contact. A sharp drop means something changed between windows, whether staffing, scheduling or priorities.
- Equity views. Reach by gender, race and grade level, each compared with the overall average. This view is stricter than the others and flags groups sitting five or more points below average, so small differences do not trigger alarm.
- Student detail. A list of students behind the numbers, filterable by School and School Year, so a lead can move from a pattern to people.
Two modelling details that matter
A stable denominator
When you chart reach by window, each window shows the students reached in that window divided by all active students. If the denominator were calculated from the filtered view, it would shrink or change as the window changed, and the line would be wrong. In the workbook, the enrolled-student count is calculated across all windows, using a level-of-detail expression that excludes window number, so every point on the line is measured against the same base.
Windows reached, not activities
"Windows reached" is a distinct count of window numbers per student, not a count of activities. A student with ten activities in one window is a partial reach, and the calculation treats them that way. This is the kind of business rule that tends to live in someone's head or a spreadsheet footnote. Writing it as a calculated field puts it in one place that everyone can read and correct.
An illustrative example
This example is hypothetical and is not project data. Two schools each report a strong overall Academic Partnering rate. The window view shows that School A holds steady across the year, while School B starts strong and falls away in the later windows. The totals look alike, and the trajectories do not. A programme lead can ask School B's team what changed, instead of congratulating both.
What Salesforce reporting does well here
Salesforce can report on activities by window, group them by school and chart them. A summary report grouped by window gives a quick view, and a dashboard filter lets users narrow it. Where the team needs only counts, that works.
Our requirements added a per-student rule (two or more distinct windows), a stable denominator, and an equity comparison against an overall average, all within one filtered view. Those were simpler for us to express in Tableau. They can be built in Salesforce, usually with more custom report types and formula work, so the choice is about maintenance and flexibility rather than possibility.
What this gives leaders
Visibility into consistency. A programme lead can see whether partnership activity is sustained or concentrated, which schools are following a different pattern, and which student groups are being missed. These are questions that shape staffing and scheduling for the next window, not just reporting for the last one.
One caution: this measures activity recorded in Salesforce, not the quality or outcome of the partnership. Treat a low reach figure as a prompt to ask questions, and a high one as evidence of coverage, not of impact.
The takeaway
Good partnership reporting looks past totals to coverage and consistency. Define reach in a way that rewards spread, hold the denominator steady, and put the rule in a calculated field. The activity record stays in Salesforce. The judgement about what it means for the next window is for the people who read the dashboard.
Frequently asked questions
Why is counting activities misleading?
Volume can come from a few students in one window. Coverage and consistency need a count of students reached in each window.
What is a stable denominator?
The number of active students used as the base for every window. Calculating it with a level-of-detail expression that ignores the window keeps each point on the line comparable.
Does this measure the impact of academic partnering?
No. It measures recorded activity and coverage. Use a low figure as a prompt for questions, not as a verdict.
Want dashboards like these for your programme? Book a free 45-minute call or see our Tableau dashboard services.