Short answer: good relationship-building metrics count students, not visits. Measure coverage, mix and timing for active students, classify each student once, and compare reach by group against the average.
Relationship building is the hardest work in a family engagement programme to measure. A home visit takes real time and effort and produces one record in Salesforce: a date, a type, a student. The value is in the trust it builds, which no dashboard can see. What a dashboard can see is whether the visits are happening, who they are reaching, and when.
That is a narrower question than "is the programme working?", and it is the one we built the Relationship Building dashboard to answer, as part of our Salesforce and Tableau nonprofit project.
Start with what the record can tell you
In the Salesforce data behind this project, relationship-building activity comes in two subtypes: home visits and community visits. Each is a Family Engagement Activity linked to a student's enrolment. That structure supports three kinds of question:
- Coverage: what share of active students has received at least one visit of either kind?
- Mix: among those reached, is contact happening in the home, in the community, or both?
- Timing: are visits spread across the year, or bunched into a few months?
A list of activities can answer none of these directly. Coverage needs a count of students, not rows. Mix needs each student classified. Timing needs a clean date axis.
What we built
The dashboard opens with a status breakdown. Every active student falls into exactly one of three groups: reached by a home visit, reached by a community visit, or unreached. The rule is deliberately plain. If a student has any home visit, they are in the first group. If not, but they have a community visit, they are in the second. Otherwise, they are unreached. A home visit takes priority, so each student is counted once.
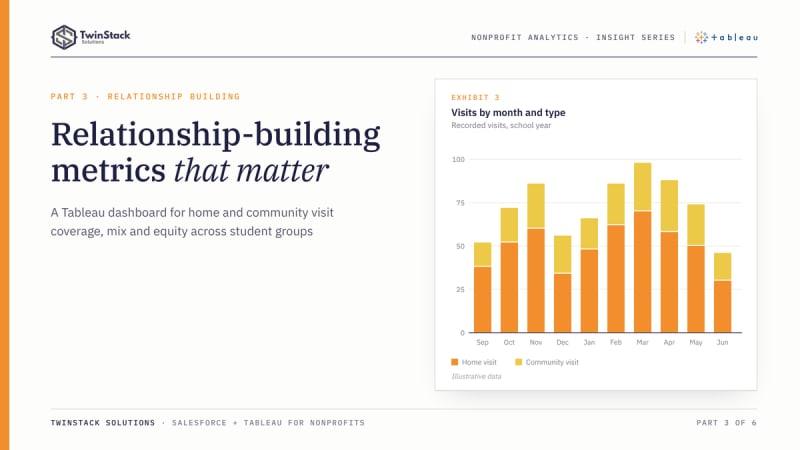
Next to it sits a month-by-month view of visits split by home and community, which shows the rhythm of the work across the year. Below that, a student detail list lets a coordinator move from a percentage to named students.
Three comparison views break reach down by gender, race and grade level, each set against the overall average. This is the equity lens, and it is where aggregate numbers are most likely to mislead. A 70 percent overall reach rate can sit on top of a 50 percent rate for one grade level, and nobody sees it unless the data is cut that way. (These percentages are invented for illustration.)
All of it responds to the School and School Year filters shared across the workbook.
The modelling that makes the numbers trustworthy
The visit counts are calculated per student with a FIXED level-of-detail expression and then combined, so a student with six home visits contributes one student to the "home visit" group, not six. The population is limited to active enrolments. Without those two decisions, a relationship-building dashboard overstates both the number of students and the reach rate, and the error is hard to spot because the chart still looks reasonable.
This is also where relationships in Tableau's data model help. Each table keeps its own level of detail, and Tableau joins them at query time based on the fields in the view (Tableau documentation). Enrolments and activities are one-to-many, and the model respects that instead of flattening it into one wide table.
What changes for management
- Where to send people. If one school has many unreached students, visit capacity can move there.
- Which kind of visit to prioritise. A school with many community visits and few home visits tells a different story from the reverse.
- When to plan. If visits cluster late in the year, scheduling can start earlier.
- Whether reach is even. The equity views show whether a group is consistently below the average.
None of this tells you whether a visit was good. It tells you whether the visits are reaching the people they were meant to reach, which is the part a report can legitimately measure.
Native Salesforce reporting, fairly
Salesforce reports can list home and community visits by month, group them by school, and chart them on a dashboard. A report with a cross filter can find students with or without a related visit. Teams that need only those views should use them.
The extra work in our case was combining student-level classification, an average to compare against, and several demographic cuts in one filtered view. Tableau's calculated fields and layout tools suited that. It remains possible to build much of it in Salesforce with additional report types and formulas.
The takeaway
Measuring relationship building means being honest about what can be measured. Count students, not rows. Limit to active enrolments. Classify once. Then show reach by type, by month and by group. That tells a leader whether the relationships are being built broadly, and it leaves the question of depth to the people who knew the families.
Frequently asked questions
What should a home visit dashboard measure?
Coverage (share of active students visited), mix (home, community or both) and timing (visits by month), plus reach by gender, race and grade against the average.
How do you avoid counting a student several times?
Calculate visits per student with a FIXED level-of-detail expression, give each student one status, and count students rather than visit rows.
Can a dashboard show whether a visit went well?
No. It shows whether visits are reaching the intended students. The quality of a visit is for the people who carried it out.
Want dashboards like these for your programme? Book a free 45-minute call or see our Tableau dashboard services.