- Tableau
- Salesforce
- Survey dashboards
- Growth during the year
Did Things Get Better This Year? How to Measure Survey Growth from Start to End
A survey tells you where you are. Two surveys tell you which way you are heading. Here is how one dashboard shows the difference.
Every program wants to answer one question at the end of the year: "Did we make a difference?"
Surveys can help, but only if you ask the same questions at the start and again at the end, and then compare the two on one page. This post shows how a Growth dashboard does exactly that, and why it surprised the team. (The program name is masked and all figures are example data.)
01 · The problem
A single survey is a snapshot, not a story
A family-engagement program surveys families and teachers twice a year, once in the fall (the start) and once in the spring (the end). Leaders knew the spring score. What they did not know was how it compared with the fall.
A spring score of 68.9% could be a success if families started at 55%. It could be a worry if they started at 80%. Without the starting point, the number has no meaning. Putting two reports side by side by hand was slow, and small differences were easy to miss.
02 · The dashboard
Two dots and a line
The Growth dashboard has two views.
1. Growth by question
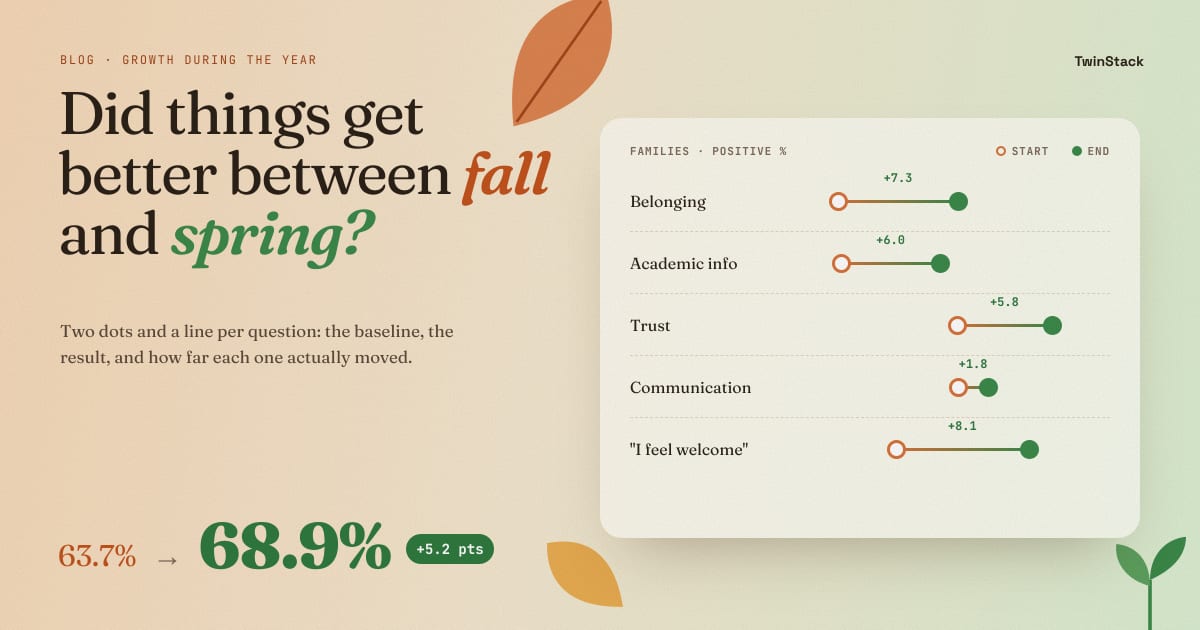
Each question gets a row with two dots: the start-of-year score on the left and the end-of-year score on the right, joined by a line. The change in points is written in the middle, for example "+8.1". A long line means a lot of movement. A tiny line means nothing moved. You do not need a legend to read it.
2. Growth by topic
One bar per topic showing how many points it moved. Bars to the right mean improvement. Bars to the left mean decline. A clear zero line sits in the middle.
Both views work for families and for teachers, and the dashboard never mixes the two groups.
03 · What growth showed
What the growth showed
For families, the year went well
The positive score rose from 63.7% to 68.9%, a gain of 5.2 points.
- Belonging improved the most, up 7.3 points.
- Academic Information gained 6.0, and Trust gained 5.8.
- Communication moved only 1.8 points.
The question view added detail. "I feel welcome when I visit my child's school" jumped 8.1 points, the biggest gain. "The school communicates with me in a language I understand" moved just 0.4. It was already among the lowest-scoring questions, and it was the one that barely improved. That is a clear signal about where to focus next.
Then came the surprise
The same dashboard for teachers told a different story. Their overall positive score slipped from 73.9% to 72.1%.
- Belonging rose 9.7 points.
- Trust fell 6.5 points, and Academic Information fell 7.1.
Families felt more welcome and more informed, while teachers felt less supported on the same two topics. Nobody had planned to look for that. A topic-by-topic bar chart with a zero line made it impossible to miss.
04 · Stakeholders
Why it matters to each stakeholder
- Program directors: can answer "did we make a difference?" with evidence, and can see where the answer is "not yet".
- Funders and the board: see progress as change over time, not a single score that is hard to judge.
- School coordinators: learn which topics improved and which stood still, and can plan the next year around the stuck ones.
- Principals: get an early prompt to talk with teachers when a score falls, before it becomes a retention problem.
05 · A note on honesty
What the dashboard cannot prove
The dashboard shows what changed. It does not prove why. A rise in family scores may come from the program, a new school leader or something unrelated. The best use of growth numbers is to start a conversation, not to end one.
The dashboard also shows only years with both surveys, so a year with only a start-of-year survey does not appear until the spring results arrive.
06 · The takeaway
Scores become evidence of progress
A survey tells you where you are. Two surveys tell you which way you are heading. A dashboard that puts them side by side, with the change written in plain numbers, turns a collection of scores into evidence of progress.
Want your survey results to drive decisions?
Talk to us about Salesforce and Tableau survey dashboards.
Related reading
- From Survey Data to Action: How Salesforce and Tableau Turn Feedback into Decisions
- How to Read Survey Results in 5 Minutes: A Simple Survey Overview Dashboard
- How to Rank Survey Questions and Know Exactly Where to Act
- Is This Year Better Than Last? How to Compare Survey Results Year over Year
- How One Program Used Survey Data to Decide Which Schools Need Support First