- Tableau
- Salesforce
- Survey dashboards
- Year over year
Is This Year Better Than Last? How to Compare Survey Results Year over Year
A flat headline does not mean a flat story. Here is how a fair year-over-year view shows what the overall score hides.
"Are we doing better than last year?" It sounds like the easiest question in the world. In practice, it is one of the hardest to answer with survey data.
This post shows how a Year-over-Year dashboard answers it fairly, and what it found that the overall score hid. (The program name is masked and all figures are example data.)
01 · The problem
Three years of surveys, no fair comparison
A family-engagement program has surveyed families at the start of every school year for three years. Each year, someone built a new report. Nobody compared them side by side, for three reasons.
- Different timing. Comparing a fall survey with a spring survey is not fair, because scores usually rise during the year.
- Changing wording. Two questions were reworded after the first year. Matching them by their wording would have broken the trend.
- Overall scores hide detail. The headline barely moved, so everyone assumed nothing was happening.
02 · The dashboard
Compare like with like
The Year-over-Year dashboard follows two simple rules. It compares the same point in the year, so fall is always compared with fall. And it matches each question by its fixed code behind the scenes, not by its wording, so a reworded question stays in the same trend.
It has two views.
1. Trend lines
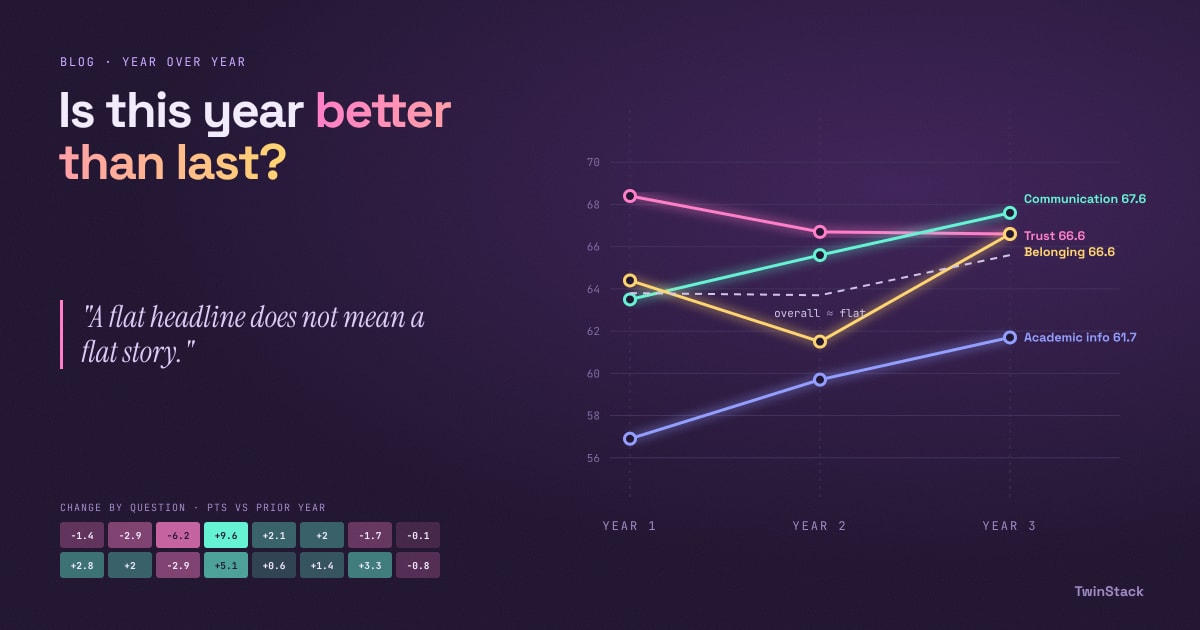
One line per topic across the school years, plus a dashed grey line for the overall score. You can see at a glance which topics are climbing, which are falling and which are flat.
2. Change by question
A color grid with questions down the side and years across the top. Each cell shows how many points that question moved compared with the year before. Gains are one color and losses are another, and the darker the color, the bigger the change.
03 · What the trends showed
What the trends showed
The overall start-of-year score looked flat: 63.8%, then 63.7%, then 65.6%. A comfortable "no change" story.
Underneath, the topics told four different stories.
- Academic Information climbed steadily, from 56.9% to 59.7% to 61.7%. Still the lowest topic, but moving the right way.
- Belonging dipped to 61.5% in the second year and then recovered to 66.6%.
- Communication edged up each year, to 67.6%.
- Trust slipped slowly, from 68.4% to 66.7% to 66.6%. It started as the strongest topic and is now level with Belonging.
The question grid went one level deeper. "I feel welcome when I visit my child's school" fell 6.2 points in the second year, then rebounded 9.6 points in the third. That is a recovery worth celebrating. By contrast, "Teachers treat me as a partner in my child's education" fell two years in a row, by 1.4 and then 2.9 points. Neither drop is dramatic on its own, but together they are a pattern. A slow slide is easy to miss in a single report and obvious on this one.
04 · Stakeholders
Why it matters to each stakeholder
- Program directors: can tell whether improvement is real and lasting, or just a good or bad year.
- Funders and the board: see a multi-year story with clear direction, which is what multi-year grants need.
- School coordinators: can spot a slow decline early and act before it becomes a complaint.
- New staff: get history at a glance, without reading three old reports.
05 · A note on honesty
Read small changes with care
A change of one or two points can be ordinary year-to-year variation, so look for larger or repeated moves, like the partnership question above. Also, the current year has only its start-of-year survey so far. The dashboard compares like with like, so the current year is compared with earlier start-of-year results until the end-of-year results arrive.
06 · The takeaway
A flat headline is not a flat story
A fair year-over-year view, matched on timing and on question, shows the slow climbs, dips and slides that single reports hide, and it gives leaders time to respond.
Next in this series: how to compare schools fairly.
Want your survey results to drive decisions?
Talk to us about Salesforce and Tableau survey dashboards.
Related reading
- From Survey Data to Action: How Salesforce and Tableau Turn Feedback into Decisions
- How to Read Survey Results in 5 Minutes: A Simple Survey Overview Dashboard
- How to Rank Survey Questions and Know Exactly Where to Act
- Did Things Get Better This Year? How to Measure Survey Growth from Start to End
- How One Program Used Survey Data to Decide Which Schools Need Support First