- Tableau
- Salesforce
- Survey dashboards
- Topics and questions
How to Rank Survey Questions and Know Exactly Where to Act
A topic score tells you where to look. Question scores tell you what to do. Here is how one dashboard connects the two.
Imagine a doctor who tells you, "Your health score is 69 out of 100." Useful? Not really. You want to know which number is low and what to do about it.
Survey results have the same problem. A topic score tells you where to look. It does not tell you what to fix. This post shows how a Topics and Questions dashboard closes that gap. (The program name is masked and all figures are example data.)
01 · The problem
A topic score is not an action
A family-engagement program surveys families on four topics: Trust, Belonging, Communication and Academic Information. Each topic has two questions, so a topic score is really the average of just two questions.
That average can hide a lot. When a coordinator saw "Communication: 68.6%", the natural reaction was, "That is fine, move on." But nobody could say what was inside that number, or which sentence families actually disagreed with. Without that, the team could not choose a concrete next step.
02 · The dashboard
Click a topic, see every question
The Topics and Questions dashboard has three views that work together.
1. Topic results
A short table with one row per topic. Each row shows the positive percent, the share of strong agreement, the share of disagreement, the average score and how many answers sit behind it.
2. Question ranking
Every question on one line, sorted from best to worst, each shown as a dot on a simple scale. You can see the spread at a glance.
3. Question detail
A table with the full wording of each question and exactly how many people chose each answer.
The three are linked. Click a topic in the first view, and the other two show only that topic's questions. Click it again, and everything comes back.
03 · The drill-down
What the drill-down showed
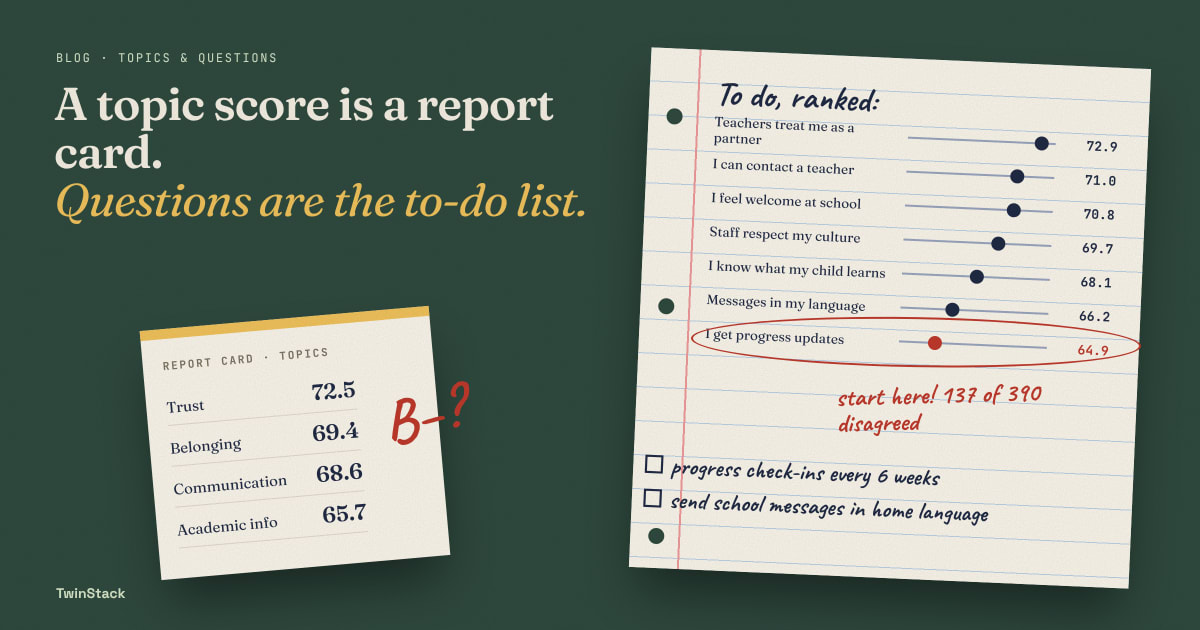
In our example, family results from the end-of-year survey ranged from 64.9% to 72.9% across the eight questions. That is an eight-point spread, and it was invisible in the topic scores. A few things stood out.
- The weakest question was about progress updates. "My child's teacher shares regular updates about my child's progress" scored 64.9%. Out of 390 people who answered, 137 disagreed. That is about 35%, or more than one in three.
- The strongest was about partnership. "Teachers treat me as a partner in my child's education" scored 72.9%.
- Communication was really two stories. The topic looked average at 68.6%. Inside it, "I know how to contact my child's teacher" scored 71.0%, while "The school communicates with me in a language I understand" scored 66.2%. The problem was not that families could not reach teachers. It was that the message did not always land in the right language.
That last finding changes the plan. "Improve communication" is a vague goal. "Check that school messages go out in families' home languages" is something a coordinator can do next week.
04 · Stakeholders
Why it matters to each stakeholder
- School coordinators: get a short, specific to-do list instead of a general worry. The lowest-ranked questions tell them where to start.
- Principals and teacher coaches: see the exact behavior families are asking for, such as regular progress updates, and can coach toward it.
- Program directors: can tell funders precisely what the program is improving and why, with the evidence one click away.
- Families: benefit most, because their own words in the survey lead to a specific change, not a general promise.
05 · The takeaway
From report card to to-do list
Topic scores show where to look. Question scores show what to do. A dashboard that lets people click from one to the other turns a survey from a report card into a to-do list.
Next in this series: how to see whether things improved during the school year.
Want your survey results to drive decisions?
Talk to us about Salesforce and Tableau survey dashboards.
Related reading
- From Survey Data to Action: How Salesforce and Tableau Turn Feedback into Decisions
- How to Read Survey Results in 5 Minutes: A Simple Survey Overview Dashboard
- Did Things Get Better This Year? How to Measure Survey Growth from Start to End
- Is This Year Better Than Last? How to Compare Survey Results Year over Year
- How One Program Used Survey Data to Decide Which Schools Need Support First