- Tableau
- Salesforce
- Survey dashboards
- School comparison
How One Program Used Survey Data to Decide Which Schools Need Support First
A fair comparison and an honest trust check on one page turned "how are we doing?" into "where do we start?"
Case snapshot
| Who | A family-engagement program supporting eight schools in two districts (name masked) |
|---|---|
| Challenge | One overall survey score hid the schools that needed help, and nobody knew how far to trust each school's result |
| Tools | Salesforce to hold the survey data, Tableau for the dashboards |
| Result | A clear, fair ranking of schools, the exact topic behind each gap, and a built-in check on who answered |
This is an illustrative case study. The program is masked, and all figures and outcomes are example data.
01 · The situation
One number that hid the story
Twice a year, the program surveys families and teachers about the partnership between home and school. After each survey, the director received a single number: 68.9% of answers were positive. It looked healthy, and the conversation usually ended there.
But the director suspected the number was hiding something. Visits to schools felt very different from one another. One school buzzed with family events, while another struggled to get parents through the door. A single average could not show that. It could only blend them.
Two questions came up in every meeting. Which school should get support first? And can we trust the scores we are looking at?
02 · The approach
Two dashboards, two questions
The first step was to put the data in one place. The survey answers lived in Salesforce, linked to the school each person belonged to. That made it possible to build two Tableau dashboards on top, each answering one of the director's questions.
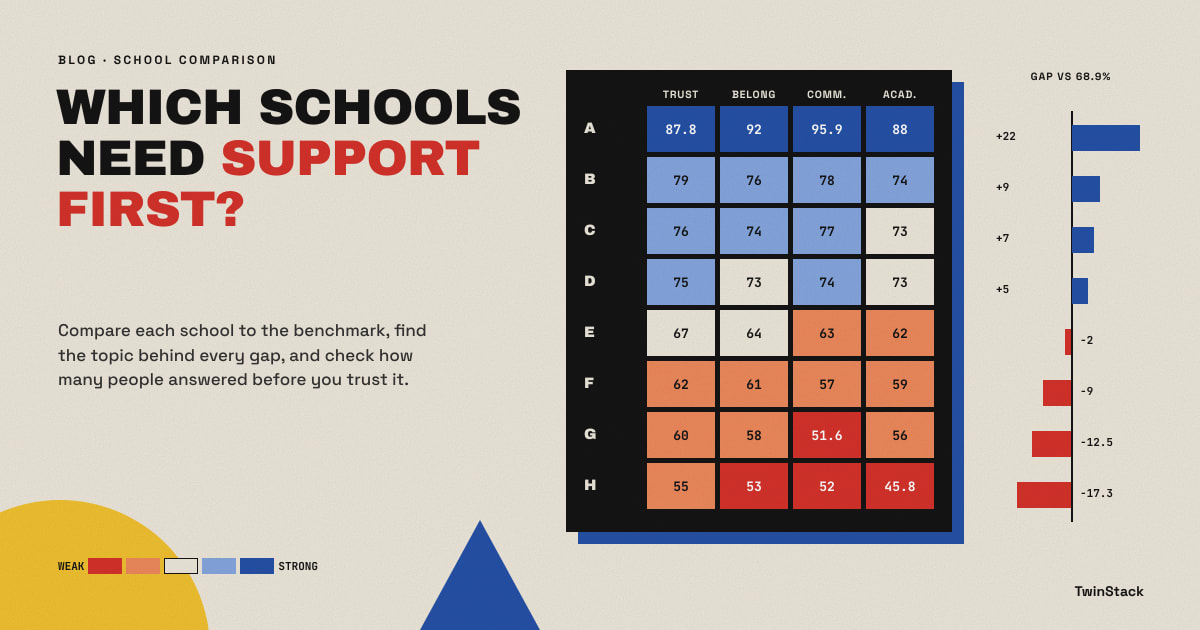
School Comparison answered "which school first?" The team measured each school against the all-schools average and showed the difference in points, sorted from strongest to weakest. A second view placed schools down the side and the four survey topics across the top, with colour showing how strong each score was.
Respondent Profile answered "can we trust it?" It counted how many people answered at each school, in each language and in each grade, so every score could be read alongside the number of voices behind it.
Behind the scenes, the rules are simple. The average counts every answer, with blank answers left out. A school's gap is its own score minus that average. The same rule applies to every school, so the comparison stays fair.
03 · What the team found
What the team found
The gap view made the picture clear. One school was 22 points above the average, at 90.9%. Three others sat 5 to 9 points above it. At the other end, two schools were about 9 points below, a newer school was 12.5 below, and one school was 17.3 points below, at 51.6%.
Then the topic grid made the findings useful. The two weakest schools had different problems.
- The lowest-scoring school struggled most with Academic Information, at 45.8%. Families did not feel they got the information they needed to support learning.
- The newer school struggled with Communication, at 51.6%, far below its other topics.
Seeing it in colour mattered. A table of 32 numbers, eight schools by four topics, is slow to read. On the grid, the weak spots stood out in seconds.
Strong results appeared too. One school scored 95.9% on Communication, and another reached 87.8% on Trust. Instead of only helping weaker schools, the director could now ask strong schools to share what they do.
"Support the weakest schools" had turned into three specific actions: help one school share academic information more clearly, help another with communication, and learn from the schools doing it well.
04 · Can we trust it?
Can we trust it?
The trust check gave the team confidence. Family responses were spread evenly, 45 to 65 per school, so no score rested on a handful of people.
It also raised honest cautions.
- About 84% of family answers were in English and 11% in Spanish, so the smaller language groups were too thin to read closely.
- Grade 6 produced only 26 of 407 responses.
- Teacher results rested on just 8 to 17 people per school, so the dashboard carries a clear note not to rank schools by them.
05 · The impact
The impact
For the program director, the meeting changed. Instead of debating whether a 69% was good, the team agreed on where to send support first and why.
District leads could see their own schools against the same benchmark, with a specific topic to discuss rather than a general worry. School leaders saw where they stood without feeling judged by one number. Funders and the board received a more honest story: strong schools recognized, weaker schools named, and the limits of the data stated plainly.
The conversation with school leaders changed too. Because the grid pointed to one topic, a visit could start with "here is what families told us about academic information" instead of "your score is low". That framing made it easier to work together.
Most importantly, families benefit when help goes where the survey says it is needed, in the language and grade where voices were quietest.
06 · Lessons learned
Lessons learned
- Compare to a benchmark. A gap in points is easier to act on than a rank.
- Break totals into topics. Two schools with the same score can need very different help.
- Show who answered. A score is only as strong as the number of voices behind it.
In summary
The program did not need more data. It needed the data it had, organised so that a fair comparison and an honest trust check sat on the same page. With Salesforce holding the answers and Tableau telling the story, the director could move from "how are we doing?" to "where do we start?"
This completes the series. Start with the overview, then drill into questions, growth and trends, and finish with school comparison.
Want your survey results to drive decisions?
Talk to us about Salesforce and Tableau survey dashboards.
Related reading
- From Survey Data to Action: How Salesforce and Tableau Turn Feedback into Decisions
- How to Read Survey Results in 5 Minutes: A Simple Survey Overview Dashboard
- How to Rank Survey Questions and Know Exactly Where to Act
- Did Things Get Better This Year? How to Measure Survey Growth from Start to End
- Is This Year Better Than Last? How to Compare Survey Results Year over Year