- Tableau
- Salesforce
- Survey dashboards
- Survey overview
How to Read Survey Results in 5 Minutes: A Simple Survey Overview Dashboard
How one dashboard turns hundreds of survey answers into a number leaders can quote, a ranking they can act on, and enough detail to trust both.
A survey closes. Hundreds of people have answered. And the first question from the leadership team is always the same: "So, how did we do?"
If the answer is a 40-page export, nobody reads it. If the answer is one number with no context, nobody trusts it. This post shows how a single Survey Overview dashboard gives a clear, honest answer in about five minutes. (The program name is masked and all figures are example data.)
01 · The problem
A headline that is easy to find and easy to trust
A family-engagement program surveys families at the start and end of every school year. Eight schools take part. Leaders wanted three things at once:
- One headline number they could quote.
- A sense of which topic is strongest and which is weakest.
- Confidence that the headline is not hiding something.
Before the dashboard, getting that meant exporting answers, counting them by hand and building a slide deck. By the time it was finished, the next survey was almost due.
02 · The dashboard
Three pieces on one page
The Survey Overview dashboard sits on top of the survey data in Salesforce and uses three simple pieces.
1. The scorecard
Four numbers at the top: how many people responded, how many questions they answered, the positive percent and the average score. The positive percent is the share of answers that were Agree or Strongly Agree. Blank answers are left out, so skipped questions do not drag the score down.
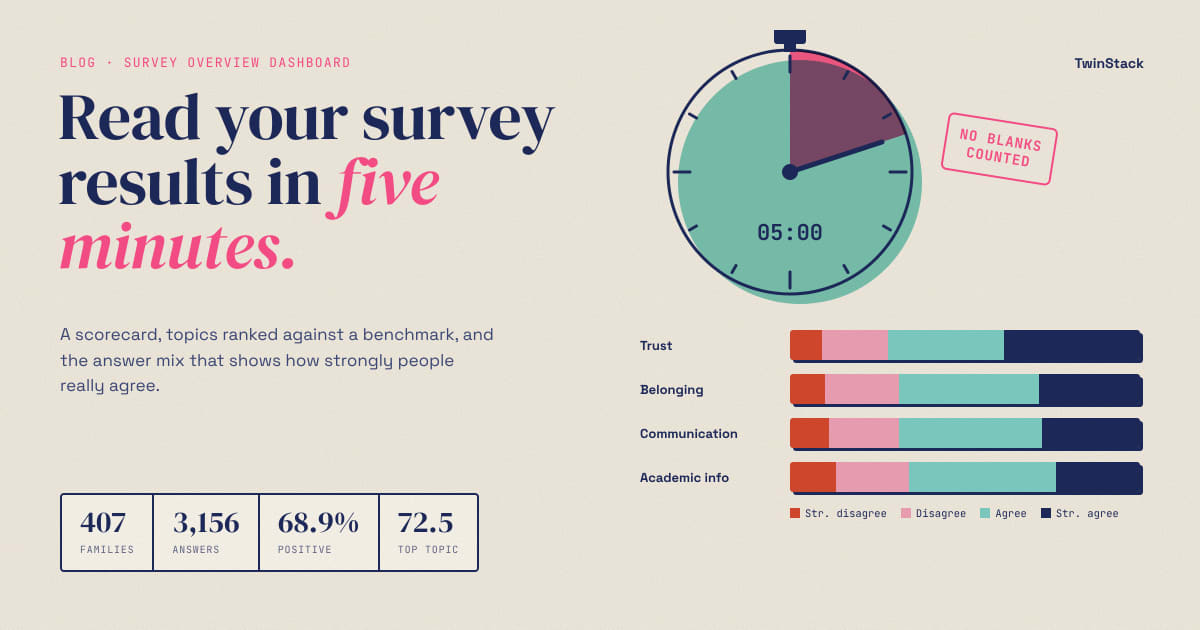
In our example, 407 families answered the end-of-year survey. They gave 3,156 answers, and 68.9% were positive.
2. The topic bars
The survey covers four topics, and the dashboard shows each one as a bar with a dashed line at the overall score. You see at a glance who is above the line and who is below it. Trust is the strongest at 72.5%. Academic Information is the weakest at 65.7%. The gap is about seven points.
3. The answer mix
This is the piece most reports skip. For each topic, a single bar is split into four colours: Strongly Disagree, Disagree, Agree and Strongly Agree. It shows how strong the opinion is, not only which side people are on.
03 · What leaders learn
What leaders learn in five minutes
Here is where the third piece earns its place. A positive score of 68.9% sounds comfortable. But look at the mix:
- Only 29% of answers were Strongly Agree.
- Another 40% were a quieter Agree.
- About 31% were Disagree or Strongly Disagree.
So roughly one answer in three was negative, and most of the positive ones were mild. That is a very different message from "69% positive". It says the partnership is solid but not yet deeply trusted, and there is real room to move.
The same view shows that Academic Information has the most negative answers (about 34%), while Trust has the fewest (about 28%). That tells a coordinator where to start.
04 · Stakeholders
Why it matters to each stakeholder
- Program director: gets a quotable headline and an early warning, within minutes of the survey closing instead of weeks later.
- Board and funders: see one clear picture of how families feel, plus the honest detail behind it. That builds trust in the program's reporting.
- School coordinators: see which topic needs attention first, so effort goes where it counts.
- Data and IT teams: know the numbers come from one place, Salesforce, and are worked out the same way every time.
05 · Tips
Three tips if you build something similar
- Leave blanks out of the maths. A skipped question is not a negative answer. In our example, 100 blank answers would have quietly lowered every score.
- Show strength, not only direction. A split between "agree" and "strongly agree" changes the story more often than people expect.
- Add a benchmark line. A number is easier to judge next to the overall average.
06 · The takeaway
Say enough, not everything
A good overview does not try to say everything. It gives leaders a number they can quote, a ranking they can act on and enough detail to trust both. Everything deeper, such as growth, trends and school comparison, can sit one click away.
Next in this series: how to find the weakest questions inside each topic.
Want your survey results to drive decisions?
Talk to us about Salesforce and Tableau survey dashboards.
Related reading
- From Survey Data to Action: How Salesforce and Tableau Turn Feedback into Decisions
- How to Rank Survey Questions and Know Exactly Where to Act
- Did Things Get Better This Year? How to Measure Survey Growth from Start to End
- Is This Year Better Than Last? How to Compare Survey Results Year over Year
- How One Program Used Survey Data to Decide Which Schools Need Support First