- Tableau
- Salesforce
- Survey dashboards
- Case story
From Survey Data to Action: How Salesforce and Tableau Turn Feedback into Decisions
How one family-engagement program stopped waiting weeks for survey results and started seeing, in minutes, where to act first.
Every spring and fall, families and teachers answer survey questions. Then the answers land in a spreadsheet, someone builds a slide deck, and by the time leaders read it, the school year has moved on.
That was the starting point for the family-engagement program in this story. A foundation supports schools. Families and educators answer the same short survey at the start of the year and again at the end. The questions cover four topics: Trust, Belonging, Communication and Academic Information.
01 · The problem
The real problem
Leaders were asking simple questions:
- How do families feel about our partnership with the school?
- Did it get better during the year?
- Is this year better than last year?
- Which schools need help first?
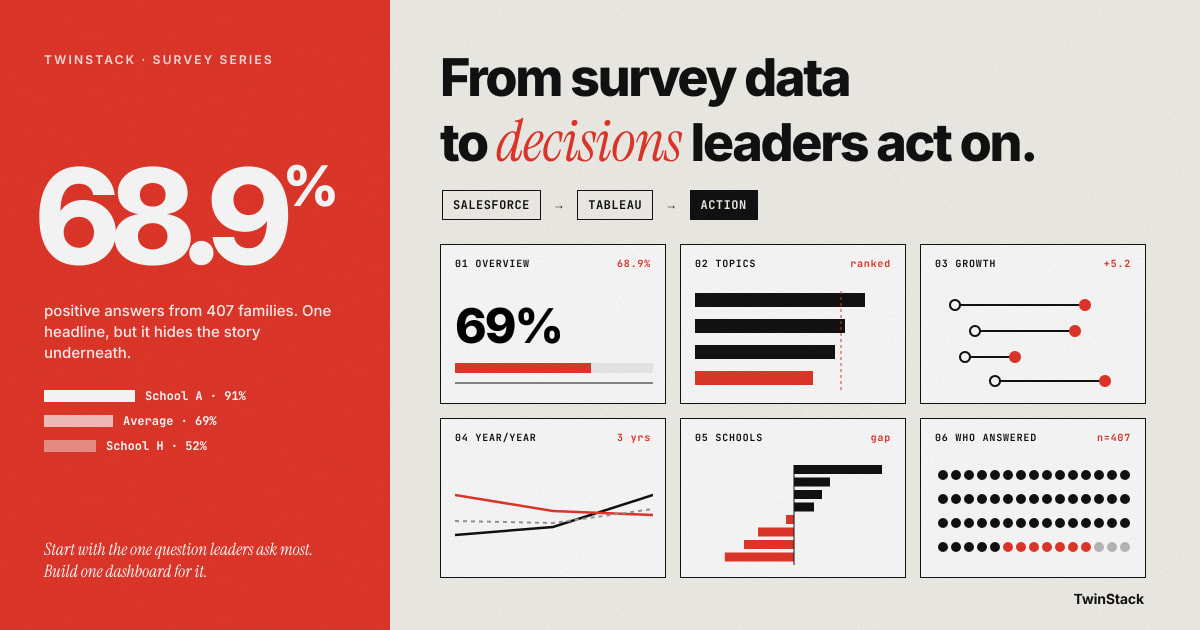
Each answer took days of counting by hand. Worse, one average across all schools hid the weakest ones. A school at 52% positive and a school at 91% were blended into a comfortable 69%.
02 · Salesforce
Step one: keep the answers in one place with Salesforce
The program already tracked its schools, students and educators in Salesforce, so the survey data went there too: the surveys, the questions, each person's response and every individual answer. Each response is linked to a school, and family responses are linked to a student's grade.
This matters because there is now one source of truth. If a record is fixed, every report shows the fix. And because answers sit next to the school and student records, we can ask who answered, not only what they said.
03 · Tableau
Step two: tell the story with Tableau
We needed one simple measure. We called it the positive percent: the share of answers that were Agree or Strongly Agree, with blank answers left out. Anyone can read it.
Tableau then turned that measure into six dashboards, each answering one plain question:
| Dashboard | The question it answers |
|---|---|
| Overview | What is the headline result? Example: 407 families answered the end-of-year survey, and 68.9% of their answers were positive. |
| Topics and questions | Which topic and which questions are weakest? |
| Growth during the year | Did things improve? Family results rose 5.2 points, with Belonging up 7.3. Teacher results told a different story, with Trust down 6.5 points. Without this view, nobody would have noticed. |
| Year over year | How does this year compare with last? One question, "teachers treat me as a partner", slipped two years in a row. |
| School comparison | Which schools are ahead or behind? One school sat 22 points above the average, another 17 points below, and its weakest topic was Academic Information at 45.8%. |
| Who answered | Which languages, grades and schools are represented, so leaders know how far to trust the result. |
04 · Why Tableau
Why we preferred Tableau for this work
Salesforce's built-in reports and dashboards are excellent at what they were made for: lists of records, counts and quick charts, right where the team works. We used them to check the data, and they remain the right tool for day-to-day record work.
Survey storytelling asks for something different, and that is where Tableau felt more natural to us. Here is what we kept reaching for:
- A fair benchmark. Showing every school against the all-schools average, on one chart, with a clear zero line.
- Change you can see. A start-of-year dot and an end-of-year dot on one line, with the gain written in the middle.
- Honest comparisons across years. Two questions were reworded after the first year. Matching on question code kept the trend intact.
- A colour map of strengths and gaps. A grid of schools by topic, where the weak spots light up at a glance.
- Click and explore. Choose a topic and the question list beside it updates.
- The right maths. Percentages worked out from answers, not records, with blanks left out.
Each of these is possible in places elsewhere, but usually with workarounds. In Tableau they are ordinary steps, and the finished page reads like a story instead of a report. The data stays live from Salesforce, so the story updates itself.
05 · Results
What changed for the people using it
The program director now reads the headline in minutes instead of waiting weeks. District leads can see which school to support first. School coordinators can see which topic to work on. The board can see whether the partnership is improving over time.
Just as important, the dashboards say what they cannot say. Teacher results at one school may rest on only eight people, so a caution note sits beside them. Trust grows when a report is honest about its limits.
06 · The takeaway
Keep the data in Salesforce. Tell the story in Tableau.
Start small: pick the one question your leaders ask most, build one dashboard that answers it, and add the rest as the questions grow.
Want your survey results to drive decisions?
Talk to us about Salesforce and Tableau survey dashboards.
Read next in this series
- How to Read Survey Results in 5 Minutes: A Simple Survey Overview Dashboard
- How to Rank Survey Questions and Know Exactly Where to Act
- Did Things Get Better This Year? How to Measure Survey Growth from Start to End
- Is This Year Better Than Last? How to Compare Survey Results Year over Year
- How One Program Used Survey Data to Decide Which Schools Need Support First