Short answer: a nonprofit performance dashboard is a consistent data model with several views on it, not a bigger dashboard. Define each measure once, calculate at the student level, and share the same filters across every view.
Most nonprofits do not lack data. They lack a place where the data agrees with itself. Relationship-building numbers come from one report, communications from another, educator participation from a spreadsheet someone updates by hand. Each is correct on its own terms, and together they do not add up to a picture.
A "360-degree" view is the answer people reach for. It is also an easy phrase to overuse. In our Salesforce and Tableau project it has a specific, limited meaning: one workbook, one data model and one set of filters covering student reach across three programme areas, school by school, along with educator participation. It does not cover fundraising, finance or anything else outside that scope.
Start with one data model, not seven dashboards
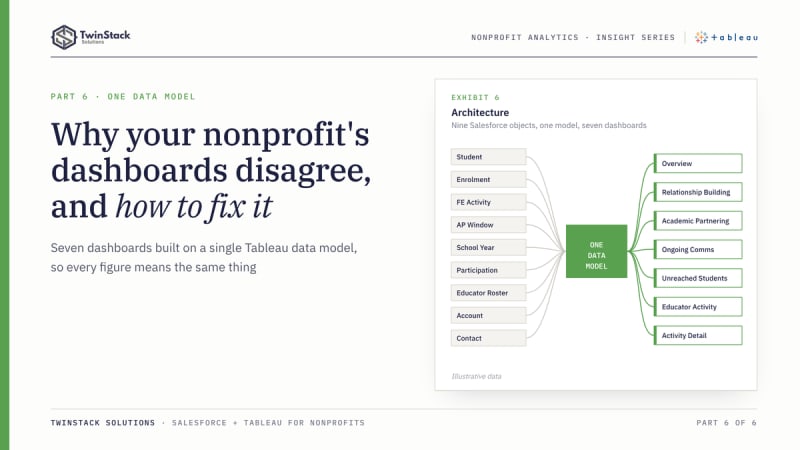
The most important decision was not a chart. It was building a single data model that every dashboard reads. The workbook connects to Salesforce and relates nine objects: students, enrolments, family engagement activities, academic partnering windows, school years, school participation, educator rosters, and the standard Account and Contact objects for schools and educators. Some of those appear more than once, because the same object plays different roles. Account is a student's school in one place and an educator's school in another.
Because every dashboard draws on that model, a figure means the same thing wherever it appears. "Active enrolled students" is defined once. "Reached" is defined once per programme. When a definition changes, it changes in one place.
This is where Tableau's relationships help. Each table keeps its own level of detail and Tableau builds joins at query time from the fields in use (Tableau documentation), which reduces the risk of repeated rows inflating counts when objects of different grain are combined.
How the seven views fit together
The order matters. The Overview carries headline tiles for enrolled students and reach in each programme, a trend of reach over time and a school scorecard. It tells a leader where to look. The three programme dashboards explain why. Unreached Students makes the gaps actionable. Educator Activity looks at the people doing the work. Activity Detail is the audit trail.
| Dashboard | The question it answers | Who is likely to use it |
|---|---|---|
| Overview | Where do we stand across all programmes, and which schools stand out? | Executives, programme directors |
| Relationship Building | Are visits reaching students, and of which type? | Programme managers |
| Academic Partnering | Is reach sustained across windows? | Programme managers |
| Ongoing Communications | How deep and how two-way is contact? | Communications and programme leads |
| Unreached Students | Who has had no contact? | Coordinators |
| Educator Activity | Which educators are taking part, and which are not? | Programme managers, school leads |
| Activity Detail | What are the records behind a number? | Analysts, administrators |
What holds a nonprofit performance dashboard together
- Shared filters. School and School Year filters appear on the dashboards, so a user can move between views looking at the same school and year.
- Shared definitions. Reach, status labels and the active-enrolment rule live in calculated fields and are reused by every view.
- Shared grain. Student-level measures are calculated per student with FIXED level-of-detail expressions, then counted. A student is a student whether they appear in a KPI tile, a status bar or a list.
Filter actions connect the charts to the lists. Selecting a mark, such as the unreached slice of a status donut or a race, gender or grade mark, narrows the student list on that dashboard, and a left-hand menu links the seven dashboards.
Where a 360-degree view earns its keep
The following is a hypothetical scenario, not project data. A director sees on the Overview that one school's communications reach is lower than its peers. On the Ongoing Communications dashboard, the shortfall is in two-way contact. The Unreached Students list names the students with no contact, and the Educator Activity view shows that several eligible educators at that school have logged nothing. Four dashboards, one school, one conversation. No single report in that chain would have told the whole story.
Salesforce and Tableau in the same picture
Salesforce remains the place where staff record activity and where the data is governed. Nothing in this solution replaces that. Salesforce dashboards will continue to serve day-to-day operational views well. Tableau sits on top for the cross-object analysis, the student-level logic and the layout flexibility that a leadership-level view needs. Salesforce also has its own analytics offerings, so the choice is not binary, and the right mix depends on your team's skills, licensing and questions.
What to build first if you are starting
- Agree on definitions in plain language: who counts as enrolled, what counts as reached.
- Check that the Salesforce data supports them, since a dashboard cannot reveal what was never recorded.
- Model the objects and their grain before drawing anything.
- Build the Overview last, from the same calculations as the detailed views.
- Add record-level detail, so every number can be checked.
The takeaway
A 360-degree dashboard is a consistent data model with several views on it, not a bigger dashboard. Get the definitions and the grain right, and the seven perspectives will agree with each other. Get them wrong, and the most attractive Overview in the world will not be trusted.
Frequently asked questions
Why do nonprofit dashboards disagree?
Each report defines measures in its own way and counts at a different grain. One shared data model with shared definitions removes the disagreement.
What should a nonprofit build first?
Plain-language definitions, then a check that Salesforce holds the data to support them, then the data model. Build the Overview last.
Does Tableau replace Salesforce dashboards?
No. Salesforce dashboards suit day-to-day operational views. Tableau adds cross-object analysis for leadership.
Want dashboards like these for your programme? Book a free 45-minute call or see our Tableau dashboard services.